Sara Irshad
Analyzing Game Sales Across the PlayStation Ecosystem
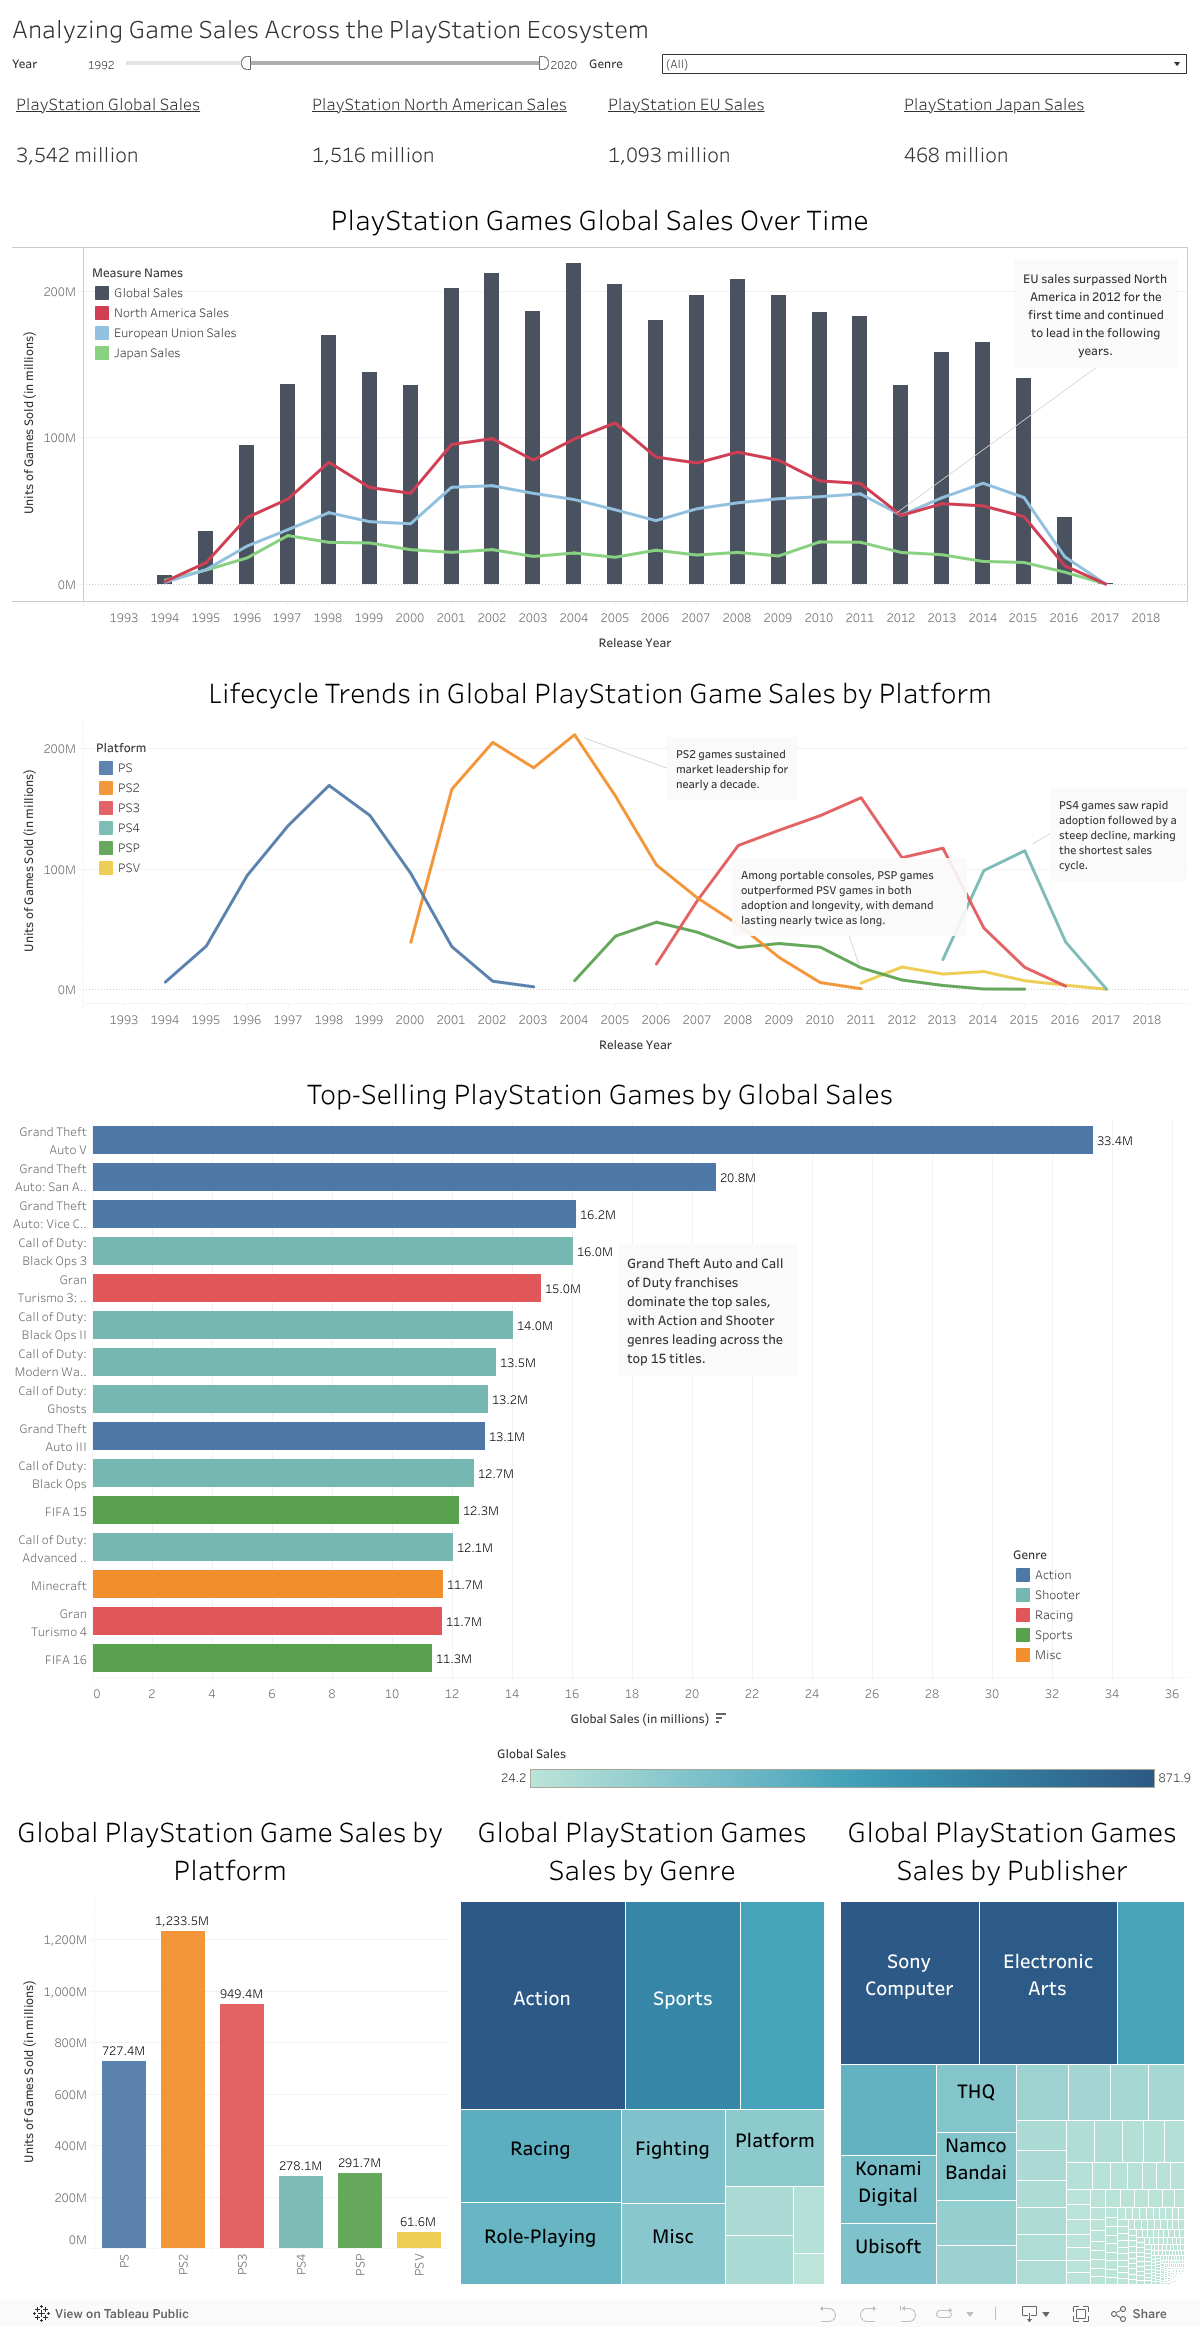
Objective: This project simulates a hypothetical request from a hypothetical product team at a video game publishing company seeking insight into PlayStation video game sales to inform game development strategy. It shows how I would approach a real-world business need from initial ask to dashboard delivery.The ask could be: “How are PlayStation games selling overall?” Based on this general question, I would ask clarifying questions to define analytics requirements and would outline what stakeholders would want to know such as:• How have PlayStation video game sales trended globally and across key regions?• Which game titles and genres are driving the most performance?• Are some PlayStation platforms still worth developing for?• Who are the dominant publishers in the ecosystem?• What patterns can we act on to guide game development roadmap?The product team's response could clarify that the goal is to identify high-performing game genres and PlayStation platforms worth investing in.Dataset: The dataset used for this project was sourced from Kaggle and originally included global sales data for video games across multiple platforms. For this analysis, I filtered the data to focus on titles released on PlayStation platforms. The dataset contained over 10,000 records and included attributes such as game title, platform, genre, publisher, release year, and regional sales figures (North America, Europe, Japan, and others).Visualizations and Business Insights: Each visualization was created to answer a specific stakeholder question in a way that invites action.1. PlayStation Games Global Sales Over TimeThis bar and line combination chart tracks overall units of games sold (in millions) and regional contributions over time.An insight that I noted from the chart is that European Union sales overtook North American sales in 2012 marking a pivotal shift that may influence regional strategy.This chart answers the “how is the industry doing globally and regionally?” question and provides immediate historical context for strategic planning.2. Lifecycle Trends in Global PlayStation Game Sales by PlatformThis chart compares game sales across platforms over time, revealing each platform's rise, peak, and decline.Some insights I noted were:• PS2 games dominated the landscape, sustaining high sales for nearly a decade.• PS4 games saw rapid early adoption followed by a sharp decline.• Among portable consoles, PSP games significantly outperformed PSV games in both longevity and adoption.This helps teams assess where game development once saw traction and where shorter life cycles may limit ROI.3. Top-Selling PlayStation Games by Global SalesThis chart breaks down the top 15 game titles based on global sales.Some insights I noted were:• Grand Theft Auto and Call of Duty dominate the top of the chart, with multiple titles each, signaling franchise consistency.• Action and Shooter genres dominate this list.These insights help teams understand what themes and franchises have consistently resonated with players.4. Global PlayStation Game Sales by PlatformThis chart compares total game units sold across PlayStation platforms to show lifetime sales performance.We see that:• PS2 leads by a wide margin, followed by PS3 and the original PlayStation.• Portable platforms (PSP, PSV) contributed less overall, signaling lower adoption.5. Global PlayStation Game Sales by GenreA fast visual breakdown of total sales by genre.• Action and Sports are the most dominant categories.This helps content teams prioritize genres aligned with market demand.6. Global PlayStation Game Sales by PublisherThis highlights publishers that consistently deliver top-selling games.• A small group of publishers (Sony and EA) account for the bulk of sales.
Real-time Interactive Weather Dashboard
This project showcases a dynamic weather forecast dashboard developed using Power BI. The objective was to build a clean, interactive interface that visualizes real-time weather data across multiple cities allowing users to easily explore current conditions, seven-day forecasts, and hourly trends.To build the dashboard, I integrated external API data and applied advanced Power Query transformations to prepare it for analysis. Some of the tasks included retrieving structured JSON from a weather API, normalizing and deduplicating records, parsing and formatting datetime fields, and merging multi-city forecasts into a unified, analysis-ready model.The dashboard includes several intuitive features. A live summary card displays the current weather and temperature for the selected city. A weekly forecast bar shows upcoming daily conditions, while a line chart visualizes temperature trends over time. Users can select any date using a custom dropdown slicer, which updates the hourly forecast line chart. Additional panels show sunrise and sunset times, a precipitation likelihood bar, and metrics such as humidity, UV index, wind speed, air quality index, and visibility.Throughout development, I also debugged API integration issues and configured automatic refreshes to ensure the dashboard stays updated with live daily values.